DATA ANALYSIS ON US CRIMES
DATA ANALYSIS USING TABLEAU
DATA ANALYSIS USING TABLEAU

Taking into account the appropriate Agency Jurisdiction and the Assaults field in a Bar graph.

The agency jurisdiction and report year are taken in columns. The sum of all categories of crimes such as rapes, violent crimes, assaults, robberies and homicides are taken in rows. Each agency code is given a unique color to represent the agency jurisdiction.

The agency juridiction and the sum of crimes percapita are plotted in horizontal bars.

The agency juridiction,report year and sum of violent crimes are plotted in line graphs.

Report year and sum of violent crimes are plotted in a line graph.

Agency jurisdiction is filtered to Albuquerque,Report year and sum of rapes are plotted in a line graph.

The agency jurisdiction,the report year(1980) and the sum of homicides in a gantt view.
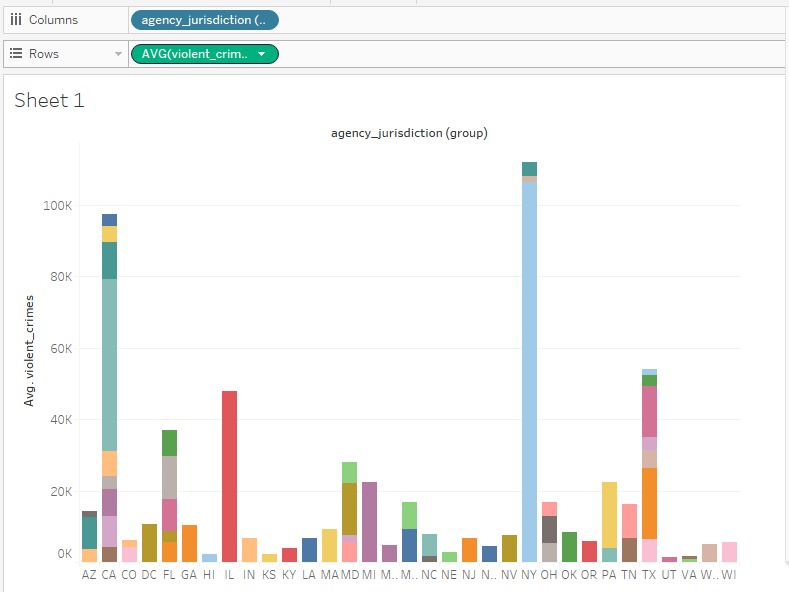
The agency jurisdiction and the average of violent crimes are plotted in a bar graph.

The agency jurisdiction is sort to find out the least, the yearbis filtered to 1975 along with the sum of population in a gantt view.

The agency jurisdiction is sort to find out the maximum average of violent crimes, the report year is filtered to 1983 along with average of violent crimes in a gantt view.

The agency jurisdiction is sort in ascending to find the safest state, the report year is filtered to 2003 and the sum of robberies are graphed into a dot plot.

The agency jurisdiction is sort in ascending to find the states with highest and least robberies overrall, and the sum of robberies are graphed into a convenient bar graph.

The agency jurisdiction is sort in descending to find the top 5 most populated, the report year is flitered to 1978 and the sum of population are graphed in a dot plot.

The agency jurisdiction is sort to find the state with least rape rate,and the sum of rapes are plotted in a bar graph.

The agency juridiction is filtered to tennessee states, the report year is filtered to 1994 and the sum of assaults percapita are graphed into a dot plot.

The agency juridiction is filtered to chicago and the sum of population are plot into a line graph.

The agency jurisdiction is filtered to Chicago and the sum of homicides are plotted in a line graph.

The agency jurisdiction is filtered to Ohio states, the report year is filtered to 2000 and the ration violent crimes and population are graphed into a dot plot.

The agency jurisdiction and average of population are plotted into a bar graph.

The agency jurisdiction,the report year and the sum of robberies are plotted into horizontal line charts.
The analysis shown have been performed using Tableau Public.
They help to answer some of the most asked and demanded questions about the US crimes.
The data has been recorded from 1975 to 2015 on assaults,homicides,rapes,robberies and other violent crimes.